PART15Combination Logic Circuit
Experiment Purpose
- 1.Understands the operation principle of decoder and encoder through experiment and predicts the usage and the application.
- 2.Understands the operation principle of multiplexer and demultiplexer through experiment and predicts the application
- 3.Investigates the operation principle and instruction through the experiment.
Experiment 1 :Decoder
Theory
Decoder is the circuit that changes binary information in code form to other forms of code. In other words, the decoder decodes the binary code and outputs it to one chosen corresponding signal.
The decoder used in CPU of the computer for decoding of address and order, and for control, and in typewriter, it is used to change the binary code from CPU as letters and print them. For example, let’s take a look at 2×4 decoder in fig.15-2. This decoder has 2 inputs and 4 outputs. This has the outputs as many as the possible combinations of binary inputs. That is, n×2n decoder has n inputs and 2n outputs. The 2×4 decoder and its truth table is as fig.15-2 and in the truth table, you can see that only one bit is 1 for the output.
Meanwhile, it is sometimes convenient to put the enable input into the decoder to control the circuit operation. For example, fig.15-3 is the 3×8 decoder which has the enable input, and if this enable input is “0”, all output becomes “0” and if it is 1, the decoder operates normally. And the decoder that has many inputs and outputs is difficult to draw so it can be expressed as a block diagram fig.15-3(b).
Fig. 15-3(a) is the decoder that has 3 inputs and 23 = 8 outputs and is composed of AND gate. This is used to change the binary number to octal or decimal number. For example, when the enable is 1 and the binary data 101 is entered to x, y, z inputs, 1 is delivered through x line, 0 through y line and 1 through z line to the output D5 and expressed as a certain signal. This signal is (101)2 and decoded in octal or decimal number to be expressed as 5.
Experiment Process
1. The circuit on the left of Circuit-1 of M-15 means 2 to 4 decoder. Use the switch to change the input as in table 15-1 and measure the voltages of output 1c, 1d, 2e, 3f and record as 1 and 0 in the relevant column. (Check out the lighting of LED.)
2. The circuit on the right of Circuit-1 of M-15 means 4 to 10 decoder. As in table 15-2, measure the voltages of output 0, 1, 2, 3, 4, 5, 6, 7, 8, 9 according to the input A, B, C, D and record the result in the relevant column. (Check out the lighting of LED.)
tab1Experiment 15-1.1 Decoder Circuit Experiment (Circuit-1 of M15)
1.Connection
1.Power connection is internally connected.
2.Measuring Instrument Connection
Connect between 1c terminal of Circuit-1 and High terminal of Multimeter on the front panel with red line, and between Low terminal and GND terminal with black line.
Wiring Diagram
flash
2.Measurement
- <2 to 4 Decoder Circuit>
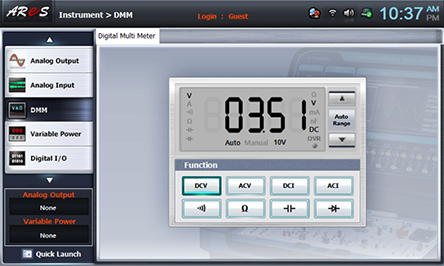
1 The circuit on the left of Circuit-1 of M-15 means 2 to 4 decoder. Use the switch S1, S2 to change the input as in table 15-1 and measure the output voltage between High terminal of Multimeter at front panel and 1c terminal of Circuit-1 and record the result in the relevant column. Change from 1c terminal to 1d, 2e, 3f terminals and measure the output voltage to record the result in the relevant column. (LED ON is “1”, OFF is “0”.)Choose dmm at Touch LCD panel and click to record the measured voltage in table 15-1.
- <4 to 10 Decoder Circuit>
2 The circuit on the right of Circuit-1 of M-15 means 4 to 10 decoder. As in table 15-2, according to the input A, B, C, D, record the LED ON of output 0, 1, 2, 3, 4, 5, 6, 7, 8, 9 as “1” and OFF as “0” in the relevant column.
Experiment Result Report
1. Experiment Result Table
2. Review and Explanation
1) With the result of table 15-1, induce the formula for each output and draw a timing chart.
2) With the result of table 15-2, induce the formula for each output and draw a timing chart.