PART9Active Filter Circuit
Experiment Purpose
- 1.Investigate characteristics of low pass filter.
- 2.Investigate characteristics of high pass filter through experiment.
- 3.Investigate characteristics of band pass filter through experiment
Experiment 1 :Low-Pass Filter
Theory
The most simple secondary low pass filter is VCVS(Voltage Controlled Voltage Source) circuit and it is as fig. 9-2. The cutoff frequency of this circuit is as below.
The thing to be considered when designing this filter is the determination of values for two resistances and two condensers. The easiest way is to make R1 and R2 same and C1 and C2 same, and the cutoff frequency here is as below.
This is also called equal component low pass filter. The gain of pass band is fixed as 1.586(4dB) in case of secondary butter worth response, and this is the only gain applied to this circuit. The cutoff frequency becomes the response in which the filter response is 3 dB below than pass band response. Under the cutoff frequency, the response decreases as 12dB/Octave or 20dB/decade. This filter uses OP-Amp at non-inverting input terminal so in order for the voltage gain to be 1.586, the feedback resistance RB should be 0.586 times of the input resistance RA. When using 5% resistances, the choices for these resistances become 27kΩ, 47kΩ each, as in fig. 9-3.
Experiment Process
1. In Circuit-1 of M-09, make the both ends of 1c-1d, 1f-1g shorted and compose a circuit as in fig. 9-4.
2. Apply the input of 1V(rms) to the both ends of 1a-1b. Change the frequency as given in table 9-1 and measure the output voltage and record it in the relevant column.
3. This time, make the 1c-1e, 1f-1h terminals shorted and compose a circuit as in fig. 9-5.
4. Apply the input of 1V(rms) and use the frequency given in table 9-1 to measure the output voltage and record it.
5. Draw a graph in the experiment result report using the measured value.
tab1Experiment 9-1.1 Low Pass Filter Experiment (In Circuit-1 of M-09, compose circuits as in fig. 9-4 (a), fig 9-5(b).)
1.Connection(Circuit-1 of M09), Fig. 9-4 LPF Circuit(a)
1.Circuit Connection
Capacitor C1, C3 Connection; Connect between 1c terminal and 1d terminal, between 1f terminal and 1g terminal of Circuit-1 with yellow lines.
2.Power Connection
It is connected internally.
3.Measuring Instrument Connection
Function Generator Connection
Plug in BNC cable to BNC terminal of Signal Output on front panel and connect red line to 1a terminal of Circuit-1, and black line to 1b terminal.
Voltmeter Connection
Input Voltage Measurement Connection: - Connect between 1a terminal of Circuit-1 and A+ terminal of Signal Input CH A on the front panel of Multimeter with red line, and between 1b terminal and A- terminal with black line.
Output Voltage Measurement Connection: Connect between 1i terminal of Circuit-1 and B+ terminal of Signal Input CH B on the front panel of Multimeter with red line, and between 1j terminal and B- terminal with black line.
2.Wiring Diagram
flash
3.Measurement
- 1Choose analog output at Touch LCD panel, click Function Generator and set up Amplitude Range as , and click of Amplitude and set up as . amplitude 15%.
Set up Signal as , and choose at Frequency and click to set up as frequency 200hz.Click and apply the output of Function Generator to input of Circuit-1.
Changing 1V(rms) as Vpp can be done by the formula below.
VPP=Vrms×2√2=1V×2×1.414=2.83VPP
The 15% of 20Vpp set up above is 3.0Vpp so it is set up as the approximation of 1V(rms).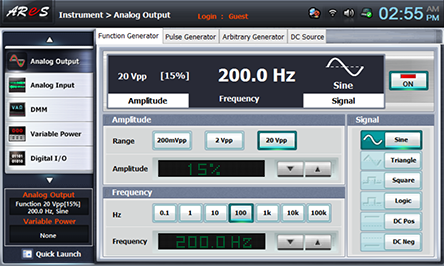
- 2Measurement
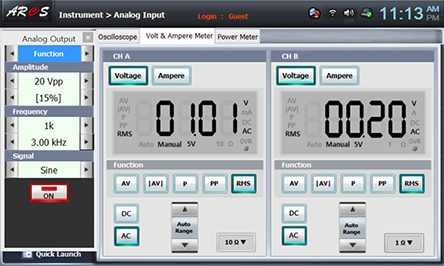
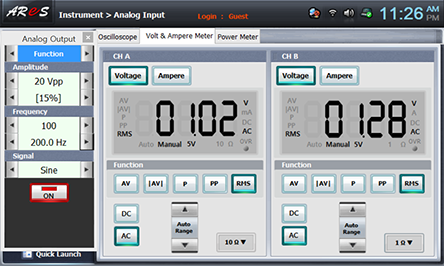
Choose analog input at front panel, choose Volt & Ampere Meter tab and click , , at CH A, CH B and record the output voltage measured at CH B in the relevant column of table 9-1.

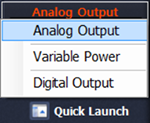
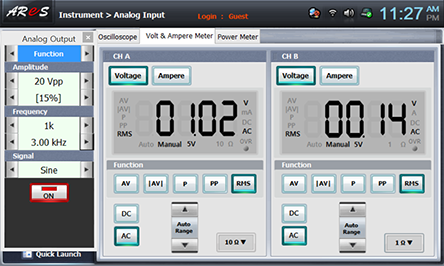
Choose quick launch on the left bottom of the screen, click Analog Output and click of Frequency at Function to change the frequency as in table 9-1. Record the measured output voltage in the relevant column of table 9-1.
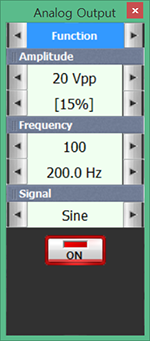
After the measurement, click at quick launch screen and cut off the output.
- 3Fig. 9-3 LPF Circuit(b) Experiment
Capacitor C2, C4 Connection: Change the connection between C1 and C3 to between 1c terminal and 1e terminal, and between 1f terminal and 1h terminal of Circuit-1 and connect with yellow lines.
Wiring Diagram
flash
Execute as the process 2) above and record the result in the relevant column of table 9-1.
After the measurement, click at quick launch screen and cut off the output.
4.Calculation
1. In LPF(a) circuit and LPF(b) circuit, calculate the cutoff frequency.
If making R1 and R2 same, and C1 and C2 same, the cutoff frequency is as below.
Experiment Result Report
1. Experiment Result Table
2. Review and Explanation
1) Using the measured result in table 9-1, draw the characteristic curve in the graph.
 haracteristic of Active Filter(LPF)
2) Using the figure and formula below, calculate the amplification degree Av, Q, cutoff frequency and 3dB frequency of circuit 9-4, 9-5. (When Q=0.699, Kc =1, K3=1)