


PART6Semiconductor-2
Experiment 3 :SCR Characteristic
Theory
In normal switching TR, to lower the internal resistance of ON status, the impurity concentration of the collector should be raised, then the reverse voltage of collector becomes lower. To overcome this, a switching element of high reverse voltage and high power is developed, and this is SCR(silicon controlled rectifier) of 4-level structure and 3 terminals. This is also called a thyristor. Pulse current over certain level should flow to the gate of SCR so that forward current can flow from anode to cathode.(Switch ON).
Operation Principle
To interpret the operation of SCR, think as in fig. 6-9(b) that two layers in the middle are split and pnp TR and npn TR are contacted.
- When the gate is earthed, Q1 is cutoff. Here, ICI=IB2=ICO1 is too small to turn on Q2. That is, when VGK=0, SCR is off.
- When + voltage(normal pulse) which is big enough is applied to the gate, Q1 is turned off, and IC1=IB2 turns on Q2, and IC2=IB1 turns on Q1 more. That is, regeneration occurs within Q1 roof so two TRs are turned on. From the moment the voltage is applied to the gate to the moment SCR is on is called turn ON time of SCR, and usually is 0.1 ~ 1μs.
- Once SCR is turned on, the ON status is maintained after removing gate voltage. Tu turn off SCR, Operate anode voltage as 0 or -. The turn OFF time is 1~30μs.
- To think interpretatively,(refer to chapter 5 concerning the polarity of current)
- The current flowing into Q2, that is, anode current I is,
When the gate current flows, value of α increases and when α1+α2 reaches 1, anode current I becomes very big. That is, SCR is turned on. If gate current is removed in this status, SCR is still turned on.
Characteristic
Fig. 6-10(a) describes the change of anode current when gate current is maintained as 0 and anode voltage is changed. When the anode voltage is increased in - direction, avalanche breakdown of SCR occurs. When it is increased in + direction, α1+α2 is small in OA region and SCR operates just as the reverse biased junction. In AB region, α value increases and at breakover voltage, α1+α2=1. If the current increases more, SCR operates just as forward biased junction. That is, it operates in CD region where anode voltage is fallen radically. When the hold current corresponding point C is made to be decreased below IH, the operation point moves from C to the origin 0 and SCR is off.
When current IG flows at the gate, α value increases and breakover voltage becomes low(fig. 6-10(b)). Generally, to turn on, the anode voltage lower than breakover voltage of IG=0 is applied and trigger signal is applied to the gate. Short pulse with peak voltage of several V, peak current of several mA ~ several tens mA is used as the trigger signal.
Experiment Process
tab1
Experiment 6-3.1 SCR Characteristic Measurement (In Circuit-3 of M06, compose a circuit as in fig. 6-11.)
1.Connection(Circuit-3 of M-06)
1.Circuit Connection
Connect between 3f terminal of circuit-3 and A terminal with yellow line, and turn on the toggle switch S1.
Turn the R3 switch clockwise to its maximum value.
2.Power Connection
Connect between V1 terminal of Variable Power on the left of M06 board and 3c terminal with red line, and between COM terminal and 3d terminal with black line.
3.Measuring Instrument Connection
Ammeter Connection
SCR gate current(IG) measurement : Measure by using the current measurement function of separate Digital Multimeter. Connect the red line of Digital Multimeter to 3i terminal of Circuit-3 and the black line to G terminal.
Load current(IL) measurement : Connect between Current mA/A terminal on the front panel of Multimeter and 3e terminal of Circuit-3 with red line, and between Low terminal and A terminal with black line.
Voltmeter Connection
Measuring voltage between A-K of SCR(VAK): Connect between A+ terminal of Signal Input CH A on the front panel and A terminal of Circuit-3 with red line, and between A- terminal and K terminal with black line.
Measuring the gate voltage of R4’s both ends(VG): Connect between B+ terminal of Signal Input CH B on the front panel and 3i terminal of Circuit-3 with red line, and between B- terminal and 3j terminal with black line.
2.Wiring Diagram
flash
3.Measurement
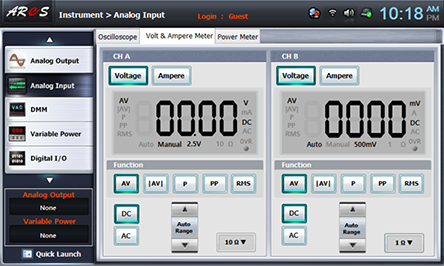
- 1Choose analog input at the left menu of Touch LCD panel, click Volt & Ampere Meter and click , , for CH A and CH B each.
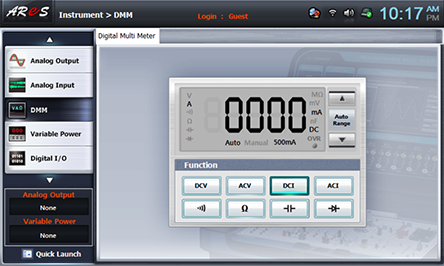
- 2Choose dmm at the left menu of Touch LCD panel and choose .
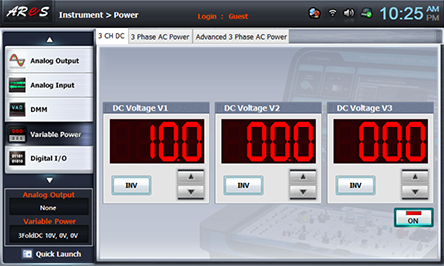
- 3Choose variable power at the left menu of Touch LCD panel and set up at 3 CH DC to make V1 as 10V with .
Click to supply DC 10V output to the circuit.
- 4Record the measured value in table 6-5.
Choose analog input at the left menu of Touch LCD panel and record the measured values of CH A(voltage between A-K of SCR(VAK)) and of CH B(gate voltage of R4’s both ends(VG)) in the relevant column.

Choose dmm at the left menu of Touch LCD panel and record the measured value of load current(IL) in the relevant column.
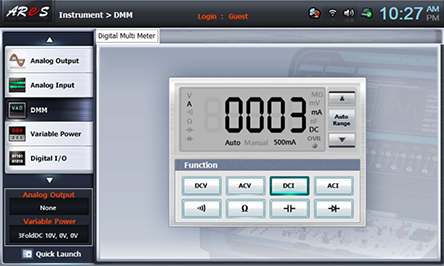
Record the measured value of SCR gate current(IG) measured by the current measurement function of separate Digital Multimeter in the relevant column.
SCR Gate Current(IG) = 3.1mA - 5In Process 3), change the input voltage as in table 6-5, execute Process 4) and record the result.
- 6Include a lamp as the load instead of load resistance R1, execute Process 3)~5) above and record it in the relevant column of table 6-5.
Circuit Connection
Remove the connection between 3f terminal of Circuit-3 and A terminal and connect between 3a terminal and 3b terminal with yellow line.
Ammeter Connections
Load current(IL) measurement: Move the red connection line from Current mA/A terminal of the front panel to 3e terminal of Circuit-3 to 3f terminal, and connect between Low terminal and A terminal with black line.
Voltmeter Connection
Measuring voltage of lamp’s both ends(V0) : Move the red connection line from A+ terminal of the front panel to 3b terminal of Circuit-3 to 3a terminal, and move the black line from A- terminal to 3e terminal to 3f terminal.
Wiring Diagram
flash
- 7After the measurement, choose varianble powerat the left menu of Touch LCD panel and click to cutoff the power supply.
Experiment Result Report
1. Experiment Result Table
2. Review and Explanation
1) In the measurement value of load resistance R1 of table 6-5, draw a characteristic curve in graph 6-3 using voltage between A-K of SCR[VAK] and load current [IL].
In table 6-5 and characteristic curve of graph 6-3, indicate forward breakover voltage (VBR), holding current(IH) and switching current(Is) and record the value.
forward breakover voltage(VBR) =
holding current(IH) =
switching current(Is) =
- In case of forward breakover voltage, how much is the current flowing to the gate?
 Graph 6-3