


PART3AC Circuit
Experiment 5 :Filter Circuit
Theory
In normal state, inductor(L) and capacitor(C) has characteristics as below regarding AC and DC. In DC, L becomes short and C becomes open. In contrary, in AC, L becomes open and C becomes short. Though extreme examples, these characteristics can be used in realizing filter circuit. Below is the circuits of LPF(Low Pass Filter), HPF(High Pass Filter), BPF(Band Pass Filter) using capacitor and inductor and the voltage change according to the frequency.
LPF
In Fig. 3-18 (a), the relationship between υi and υo is as below.
In the formula above, if ω, that is, f increases to become bigger than certain value fc, υo/υi gets smaller and becomes near to “0”, as in Fig. 3-18(b). Therefore, in the formula υo=Kυi, it can be assumed that when the frequency of υi gets bigger than fc, υo gets near to "0" and at υi, only low frequency is expressed to υo. Like this, the circuit in Fig. 3-18(a) works as Low Pass Filter which passes low frequency only.
HPF
Fig. 3-19(a) shows a high pass filter using R and L, and here, the relationship between υi and υo is as below.
In the formula above, if ω, that is, f decreases to become smaller than certain value fc, υo/υi gets smaller and smaller and becomes near to “0”, as in Fig. 3-19(b). Therefore, from the relationship of υo=Kυi, the more the frequency of υ_i becomes smaller than fc, the more υo gets near to “0”, so only higher frequency of υi can be expressed in υo. Using this characteristic, the circuit in Fig. 3-19(a) can be used as high pass filter(HPF).
BPF
Fig. 3-20(a) shows a band pass filter(BPF) circuit and here υi and υo have relationship as below
In the formula above, if ω, that is, f increases to become bigger than certain value f1, υo/υi gets bigger and bigger, and if it becomes bigger than f2, υo/υi becomes smaller again to become near to "0", as in Fig. 3-20 (b). Therefore, if the frequency of υi is bigger than f1, then the frequency smaller than f2 can be expressed in υo. Using this characteristic, the circuit in Fig. 3-20(a) can be used as band pass filter(BPF).
Experiment Process
tab1
Experiment 3-5.1 RC LPF Circuit (Compose Circuit-5 of M-03 as in Fig. 3-21)
1.Connection
1.Set up R1 as 20㏀
Connect between Multimeter High terminal of front panel and 5a terminal with red line, and connect Low terminal to 5c terminal.
Remove the connection line.
2.Circuit Connection
Function Generator Connection
Connect between A+ terminal of Signal Output on the front panel and 5a terminal of Circuit-5 with red line, and between A- terminal and 5d terminal with black line.
Oscilloscope and Voltmeter Connection
Connect between A+ terminal of Signal Output CH A on the front panel and 5a terminal of Circuit-5 with red line, and between A- terminal and 5d terminal with black line.
Connect between B+ terminal of Signal Output CH B on the front panel and 5c terminal of Circuit-5 with red line, and between B- terminal and 5e terminal of Circuit-5 with black line.
2.Wiring Diagram
flash
3.Measurement
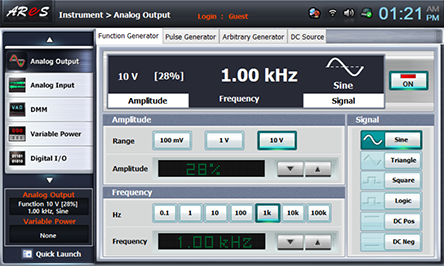
- 1Choose analog output at the left menu of front panel.
In Function Generator window, choose Amplitude as and click to set up the amplitude as amplitude 28% .
Choose Frequency as frequency 1.0khz
Choose Signal as and click to output 1kHz 2Vrms.
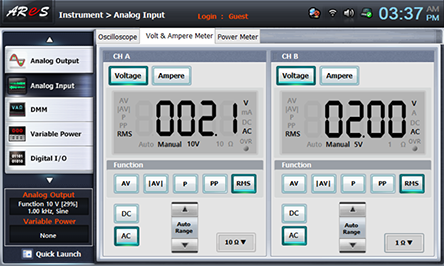
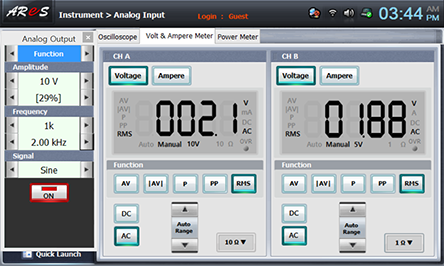
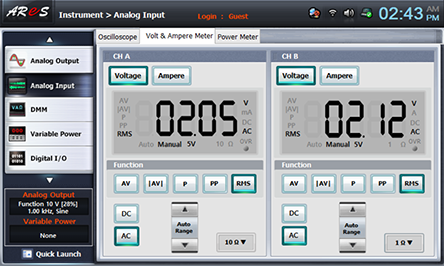
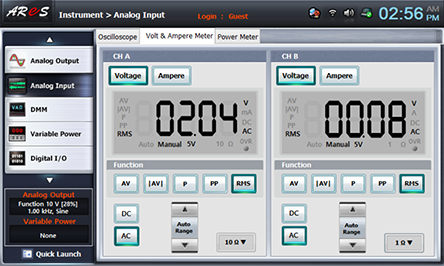
- 2Choose signal input at the left menu of front panel.
Choose Volt & Ampere Meter and choose , , at CH A and CH B each
Check out if the value of CH A is 2Vrms and record the value of CH B in table 3-9.
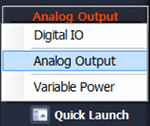
- 3Choose quick launch at the left menu of front panel and click analog output
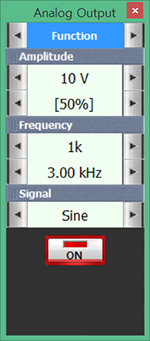
Click on the right of Frequency 1.00kHz to increase the frequency 1kHz, and record the measured value indicated in CH B of Volt & Ampere Meter in the Relevant Frequency column of table 3-9. (CH B is EC1)
Measure and record with changing the frequency to 20 kHz.
4.Calculation
1. Calculate the frequencies of -3dB, -6dB and record the values in table 3-10.
Experiment 3-5.2 RC HPF Circuit (Compose Circuit-5 of M-03 as in Fig. 3-22)
1.Connection
1.Set up R2 as 20㏀
Connect between Multimeter High terminal of front panel and 5a terminal with red line, and connect Low terminal to 5c terminal
2.Circuit Connection
Function Generator Connection
Connect between A+ terminal of Signal Output on the front panel and 5f terminal of Circuit-5 with red line, and between A- terminal and 5i terminal with black line.
Oscilloscope and Voltmeter Connection
Connect between A+ terminal of Signal Output CH A on the front panel and 5f terminal of Circuit-5 with red line, and between A- terminal and 5i terminal with black line.
Connect between B+ terminal of Signal Output CH B on the front panel and 5h terminal of Circuit-5 with red line, and between B- terminal and 5j terminal of Circuit-5 with black line.
2.Wiring Diagram
flash
3.Measurement
- 1Execute the Measurement of Experiment 3-5.1 LPF Circuit
- 2(CH B is ER2)
4.Calculation
1. Calculate the frequencies of -3dB, -6dB and record the values in table 3-10.
Experiment 3-5.3 3 LC LPF Circuit (Compose Circuit-5 of M-03 as in Fig. 3-23)
1.Connection
1.Circuit Connection
Function Generator Connection
Connect between A+ terminal of Signal Output on the front panel and 5k terminal of Circuit-5 with red line, and between A- terminal and 5n terminal with black line.
Oscilloscope and Voltmeter Connection
Connect between A+ terminal of Signal Output CH A on the front panel and 5k terminal of Circuit-5 with red line, and between A- terminal and 5n terminal with black line
Connect between B+ terminal of Signal Output CH B on the front panel and 5l terminal of Circuit-5 with red line, and between B- terminal and 5o terminal of Circuit-5 with black line.
2.Wiring Diagram
flash
3.Measurement
- 1Choose analog output at the left menu of front panel.
In Function Generator window, choose Amplitude as and click to set up the amplitude as amplitude 28% .
- Choose Frequency as frequency 1.0khz
Choose Signal as and click to output 1kHz 2Vrms.
- 2Choose signal input at the left menu of front panel.
Choose Volt & Ampere Meter and choose , , at CH A and CH B each
Check out if the value of CH A is 2Vrms and record the value of CH B in table 3-11.
- 3Choose quick launch at the left menu of front panel and click analog output
Click on the right of Frequency 1.00kHz to increase the frequency 1kHz, and record the measured value indicated in CH B of Volt & Ampere Meter in the Relevant Frequency column of table 3-11. (LPF).
Measure and record with changing the frequency to 20 kHz.
- 4Connection of the resistance load R3 and Measurement
In Circuit-5, connect between 5l terminal and 5m terminal with yellow line
Execute process of Measurement 1)~3) and record the measured value indicated in CH B in the relevant Frequency with Load column of table 3-11(LPF).
4.Calculation
1. Calculate the frequencies of -3dB, -6dB and record the values in table 3-12
Experiment 3-5.4 LC HPF Circuit (Compose Circuit-5 of M-03 as in Fig. 3-24)
1.Connection
1.Circuit Connection
Function Generator Connection
Connect between A+ terminal of Signal Output on the front panel and 5q terminal of Circuit-5 with red line, and between A- terminal and 5t terminal with black line
Oscilloscope and Voltmeter Connection
Connect between A+ terminal of Signal Output CH A on the front panel and 5q terminal of Circuit-5 with red line, and between A- terminal and 5t terminal with black line.
Connect between B+ terminal of Signal Output CH B on the front panel and 5r terminal of Circuit-5 with red line, and between B- terminal and 5u terminal of Circuit-5 with black line.
2.Wiring Diagram
flash
3.Measurement
- 1Execute process of Measurement 1)~3) and record the measured value indicated in CH B in the relevant Frequency with No Load column of table 3-11(HPF).
Execute process of Measurement 1)~3) and record the measured value indicated in CH B in the relevant Frequency with No Load column of table 3-11(HPF).
In Circuit-5, connect between 5l terminal and 5m terminal with yellow line.
Execute process of Measurement 1)~3) and record the measured value` indicated in CH B in the relevant Frequency with Load column of table 3-11(LPF).
- 2Connection of the resistance load R4 and Measurement
In Circuit-5, connect between 5r terminal and 5s terminal with yellow line.
Execute process of Measurement 1)~3) and record the measured value indicated in CH B in the relevant Frequency with Load column of table 3-11(HPF).
4.Calculation
1. Calculate the frequencies of -3dB, -6dB and record the values in table 3-12.
Experiment Result Report
1. Experiment Result Table
1) Draw the measurement value of table 3-9 in the graph below.
(LPF)
(HPF)
2) If point of 2V is 0 dB and point of 1.5V is –3dB, record the value of Y axis where it meets with the graph in table 3-10. Also, if the point of 1.0V is –6dB, record the value of Y axis where it meets with the graph in table 3-10.
2. Review and Explanation
1) In the circuits of Fig. 3-20. 3-21, calculate the cutoff frequency(fC) and the frequency at the point of –6dB, record it in table 3-10 and compare it with the measured result.
2) Explain the reason why the measured fC and calculated fC are different.
3. Discuss the experiment result
Experiment Result Report
1. Experiment Result Table
1) Draw the measured value of table 3-11 in the graph below. (Red-Load, Green–No Load)
(LPF)
(HPF)