


PART8Basic Electrical Circuit
Experiment 5 :Multistage Cascade Amplifier
Theory
If the amplification of single transistor amplifier is not enough for certain purpose, more than two amplification stages can be connected as cascade. That is, the output of previous stage is connected to the input of next stage as fig.8-22. These two CE stages are RC connected. Total voltage amplification AV of multistage amplifer is same as the multiplication of voltage gain of each stage. That is, AV=AV1+AV2.
The first stage is CE connected to the emitter resistance R14 that does not include bypass capacitor. This amplifier is called reverse feedback CE amplifer. CE ampifer has many advantages of reverse feedback such as noise and distortion decrease, frequency response improvement and so on. However, the gain of the amplifier with reverse feedback is decreased.

Experiment Process
1. Using Block e of M08, make a connection as in fig.8-22.
2. Connect the power of power supply as DC 10V.
3. Using DC voltmeter of separate digital multimeter, measure and record the voltage between GND terminal and the terminal in table 8-6.
4. Calculate and record the collector current of TR5 and TR6.
5. Connect the cable between TR6 emitter and C7, set up the output of function generator as 1kHz, 50mVpp and supply it to VIN input.
6. Using the oscilloscope, measure and record the AC voltage between GND terminal and the terminal in table 8-7.
7. Using the measured result above, calculate and record the voltage gain.
8. Calculate and record the total voltage gain.
9. Increase the signal voltage of function generator that is inputted to VIN, gain the output whose output waveform is distortionless and record this output voltage.
10. Set up the input frequency as table 8-8 and measure and record the output voltage and the gain.
- Using the measured VO, f value in table 8-8, draw the characteristic curve(frequency response curve) in the graph.
- Indicate the lower cut-off frequency point(-3dB in low frequency range) and higher cut-off frequency point(+3dB in high frequency range) at frequency response curve.
11. Remove the cable between TR6 emitter and C7, execute process 6 and record the result in table 8-9.
12. Execute process 7~9 and record the result.
13. Make the output of function generator that is inputted to VIN as 1Vpp, execute process 10 and record the result in talbe 8-10.
tab1Experiment 8-5.1 (In Block e of M08, compose a circuit as in fig.8-22.)
1.Connection(Block e of M08)
DC Voltage Measurement
1.Circuit Connection
In Block e of M08, connect between the collector terminal of TR5 and upper terminal of C6 with yellow line.
2.Power Connection
Connect between V1 termiinal of Variable Power on the left of M08 board and B+ terminal of Block e with red line, and between COM terminal and the earthing terminal with black line.
3.Measuring Instrument Connection
Voltmeter Connection
Connect between High terminal of Multimeter on front panel and the base terminal of TR5 of Block e on M08 board with red line, and between Low terminal and the earthing terminal of Block e with black line.
2.Wiring Diagram
flash
3.Measurement
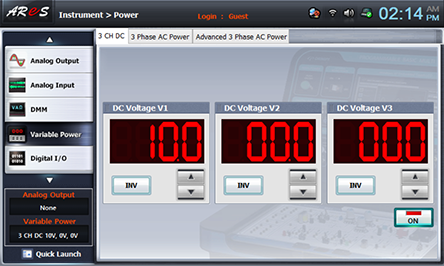
- 1Choose variable power at left menu of Touch LCD panel and set up at 3 CH DC for DC Voltage V1 to become 10V.
Click , and supply the output of DC 10V to the circuit.
Turn on the SW5.
- 2Choose dmm at left menu of Touch LCD panel and click .
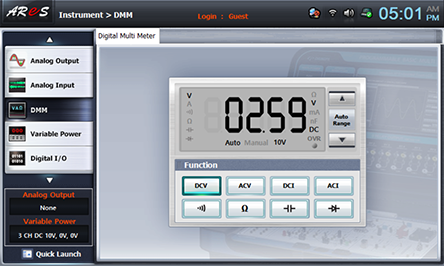
Record the measured value in VA column of table 8-6.
Disconnect the red lead wire that is connected between High terminal of Multimeter on front panel and the base terminal of TR5 of Block e on M08 board. Connect it again to collector(VB) of TR5, emitter(VC) of TR5, base(VD) of TR6, collector(VE) of TR6 and emitter(VF) of TR6 and measure the voltage and record the resultin the relevant column of table 8-6.
AC Voltage Measurement
4.Connection
1.Add the connection below to the connection of DC Voltage Measurement.
In Block e of M08 board, connect between the emitter terminal of TR6 and upper terminal of C7 with yellow line.
Function Generator Connection
Connect between A+ terminal of Signal Input CH A on front panel and the left terminal of C5 of Block e the earthing terminal of Block e with black line.
Voltmeter Connection
Connect between A+ terminal of Signal Input CH A on front panel and the base terminal of TR5 of Block e on M08 board with red line, and between A- terminal and the earthing terminal of Block e with black line.
Connect between B+ terminal of Signal Input CH B on front panel and the lower terminal of R17 of Block e on M08 board with red line, and between B- terminal and the earthing terminal of Block e with black line.
5.Wiring Diagram
flash
6.Measurement
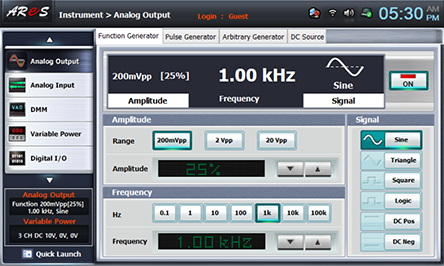
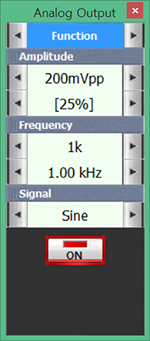
- 1Choose analog output at left menu of front panel, click Function Generator and set up Amplitude as , amplitude 25% , Frequency as , Signal as and click to output 1kHz 50mVpp.
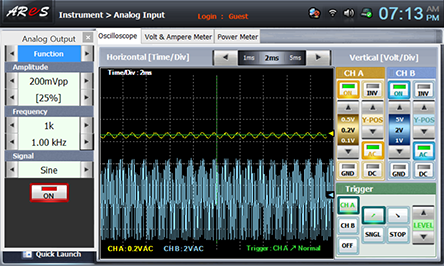
- 2Choose analog input at left menu of Touch LCD panel, choose Volt & Ampere Meter tab and choose , , for CH A and CH B each.
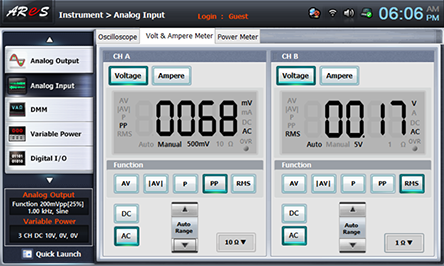
Record the measured value in VA column of table 8-7.
Disconnect the red lead wire that is connected between Signal Input A+ terminal on front panel and the base terminal of TR5 of Block e on M08 board. Connect it again to collector(VB) of TR5, emitter(VC) of TR5, base(VD) of TR6, collector(VE) of TR6 and emitter(VF) of TR6 and measure the voltage and record the resultin the relevant column of table 8-7.
Increase the input voltage in the range that the output waveform of the amplifier is not distorted.
Draw the output waveform(CH B) in the relevant column of table 8-7 and record the output voltage.
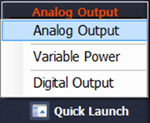
- 3Click quick launch at the lower left menu Touch LCD panel and choose Analog Output and click 25% of to increase the output voltage. Increase it till the signal waveform of CH B is distortionless and measure the distortionless output voltage of CH B and record the result in table 8-7.
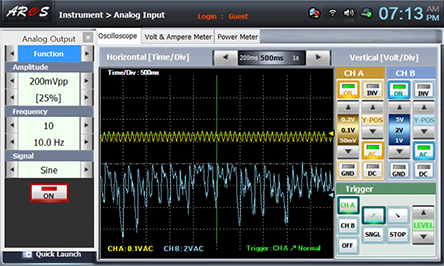
- 4Click quick launch and set up the frequency as 10 at Analog Output and click 10hz of to set up the input frequency as table 8-8 and measure the output voltage and the gain and record the result in the relevant column.

- 5As the wiring diagram below, remove the yellow line connected between the emitter terminal of TR6 of Block e on M08 board and the upper terminal of C7, and execute process 1)~3) of 6. Measurement and record the reslt in table 8-9.
flash
- 6Execute process 4) of 6. Measurement and record the result in table 8-10. Here, the output of function generator that is inputted to VIN is 1Vpp.
- 7After the measurement, choose variable power at left menu of Touch LCD panel, click to cut off the power supply, and click at analog output to cut off the function generator.
Experiment Result Report
1. Experiment Result Table
VO =Vpp
VO =Vpp
2. Review and Explanation
1) With the measured VO, f value in table 8-8 and 8-10 above, draw the characteristic curve(frequency response curve) in the graph. (Table 8-8 is red, table 8-10 is blue)
Indicate the lower cut-off frequency point(-3dB in low frequency range) and higher cut-off frequency point(+3dB in high frequency range) at frequency response curve.