


PART11Oscillator Circuit
Experiment 5 :LC Resonance Circuit
Theory
LC resonance is usually used for the generation of high frequency signal. There are 4 types of LC oscillator and these are used widely for sending/receiving of radio broadcasting. The 4 types are Armstrong, Hartely, Colpitts, and Clapp oscillations.
Fig.11-8 indicates Hartely oscillation circuit including DC feedback circuit. The circuit for oscillation is composed of L1 and C8. The oscillation frequency is determined by two components, and the expression formula is as below.
L1 is henry, C8 is farad, and fo is hertz. C9 capacitor is supplied for the AC impedance of basic signal of TR5.
Experiment Process
1. Using Block c of M11 board, make a connection as in fig.11-8.
2. Make the output power of DC power supplier as 10V and connect it to the circuit.
3. In fig.11-8, use the formula fo=1/2π √ L1C8 with L1 and C8 value and calculate the value of resonance frequency.
- when L1 = 2mH
- when L1 = 4.1mH
4. Measure the waveform of the output terminal using the oscilloscope and record the result in the relevant column of table 11-6.
5. Turn the core at L1 to locate at the top, and record the size of output frequency and output signal.
6. Turn the core at L1 to locate at the bottom, and observe and record the output frequency and voltage.
7. Observe the result when the value of L1 is at the maximum and at the minimum, and describe the role of L1.
tab1Experiment 11-5.1
1.Connection(Block d of M11)
1.Power Connection
Connect between V1 terminal of Variable Power on the left of M11 board and V+ terminal of Block d with red line, and between COM terminal and the earthing terminal with black line.
2.Measuring Instrument Connection
On the front panel, connect between A+ terminal of Signal Input CH A and the OUT terminal of Block d on M11 board with red line, and between A- terminal and the earthing terminal of Block d with black line.
2.Wiring Diagram
flash
3.Measurement
- 1Choose variable power at left menu of Touch LCD panel and set up at 3 CH DC for DC Voltage V1 to become 10V.
Click , and supply the output of DC 10V to the circuit.
Turn on the SW6.
- 2Choose analog input at the left menu of Touch LCD panel, choose Oscilloscope tab to observe the waveform of CH A.
Turn the core at the upper part of L1 to locate at the top, and record the output waveform in the relevant column of table 11-6.
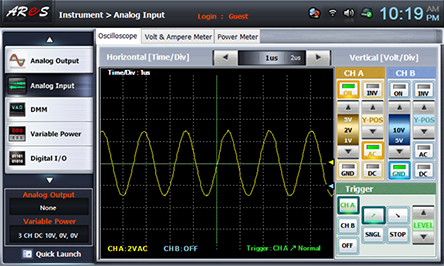
Turn the core at the upper part of L1 to locate at the bottom, and record the output waveform in the relevant column of table 11-6.
- 3After the measurement, choose variable power at left menu of Touch LCD panel, and click to cut off the power supply.
Experiment Result Report
1. Experiment Result Table
2. Review and Explanation
1) In fig.11-8, use the formula fo=(1/2π) √ L1C8 with L1 and C8 value and calculate the value of resonance frequency.
- Resonance Frequency when L1 = 2mH : kHz
- Resonance Frequency when L1 = 4.1mH : kHz