


PART11Oscillator Circuit
Experiment 4 :LED Flickering Circuit
Theory
Fig.11-7 is a circuit for the experiment of astable multivibrator circuit. R9 and R14 are used for the flickering of LED1 and LED2. When TR3 is conducted, LED1 is turned on, and when TR4 is conducted, LED2 is turned on. The transistor TR3 and TR4 are conducted in turn by the astable multivibrator, and turns on the LED1 and turns off the LED2. The frequency characteristic of the switch is as below.
(Here, R10=R13=R, C6=C7=C)
Experiment Process
1. Using Block c of M11 board, make a connection as in fig.11-7.
2. Make the output power of DC power supplier as 10V and connect it to the circuit.
3. Measure the waveform of base and collector terminals of TR3 and TR4 using the oscilloscope and record the result in the relevant column of table 11-5.
4. Calculate the frequency characteristic of the oscillator using the formula below.
Experiment 11-4.1
1.Connection(Block c of M11)
1.Circuit Connection
In Block c of M11 board, connect between the lower terminal of R8 and the collector terminal of TR3 with yellow line.
In Block c of M11 board, connect between the lower terminal of R10 and the base terminal of TR4 with yellow line.
In Block c of M11 board, connect between the lower terminal of R13 and the base terminal of TR3 with yellow line.
In Block c of M11 board, connect between the lower terminal of R15 and the collector terminal of TR4 with yellow line.
2.Power Connection
Connect between V1 terminal of Variable Power on the left of M11 board and V+ terminal of Block c with red line, and between COM terminal and the earthing terminal with black line.
3.Measuring Instrument Connection
Measuring base and collector waveform of TR3
On the front panel, connect between A+ terminal of Signal Input CH A and the base terminal of TR3 of Block c on M11 board with red line, and between A- terminal and the earthing terminal of Block c with black line.
On the front panel, connect between B+ terminal of Signal Input CH B and the collector terminal of TR3 of Block c on M11 board with red line, and between B- terminal and the earthing terminal of Block c with black line.
2.Wiring Diagram
flash
3.Measurement
- 1Choose variable power at left menu of Touch LCD panel and set up at 3 CH DC for DC Voltage V1 to become 10V.
Click , and supply the output of DC 10V to the circuit.
Turn on the SW4, 5.
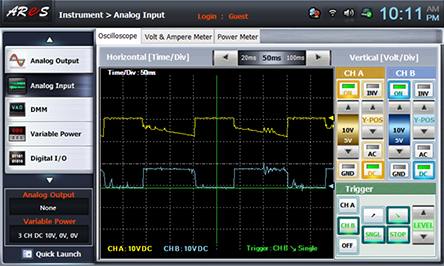
- 2Choose analog input at the left menu of Touch LCD panel, choose Oscilloscope tab to observe the waveform of CH A(base of TR3), CH B(collector of TR3) and draw the result in the relevant column of table 11-5.
- 3For <Measuring base and collector waveform of TR4>, connect the measuring instrument as below.
On the front panel, connect between A+ terminal of Signal Input CH A and the base terminal of TR4 of Block c on M11 board with red line, and between A- terminal and the earthing terminal of Block c with black line.
On the front panel, connect between B+ terminal of Signal Input CH B and the collector terminal of TR4 of Block c on M11 board with red line, and between B- terminal and the earthing terminal of Block c with black line.
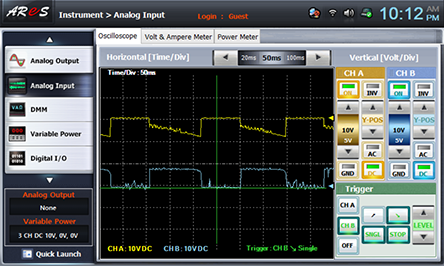
Observe the waveforms of CH A(base of TR4), CH B(collector of TR4) and observe the result in the relevant column of table 11-5.
- 4After the measurement, choose variable power at left menu of Touch LCD panel, and click to cut off the power supply.s