


PART1R, L, C Circuit
Experiment 20 :LC Filter
Theory
Inductor(L) and capacitor(C) have characteristics as below for DC and AC in normal state. In DC, L is shorted and C is opened. On the contrary, in AC, L is opened and C is shorted. Above is an extreme example but the filter circuit can be realized using this characteristics. Below are the voltage change by the circuit and frequency of LPF(Low Pass Filter), HPF(High Pass Filter), BPF(Band Pass Filter) using capacitor and inductor.
A. Low Pass Filter
In fig.1-34(a), the relationship between vi and v0 is as below.
In the formula above, if ω, that is, f increases and gets bigger than constant value fc, v0/vi becomes smaller and smaller and becomes near to "0", as in fig.(b). Therefore, from the relationship of v0=Kvi, it can be found that as the frequency of vi becomes bigger than fc, v0 gets near to "0", and only low frequency of vi is expressed at v0. Like this, the circuit in fig.(a) functions as low pass filter(LPF) which passes low frequency only.
B. High Pass Filter

Fig.1-35(a) is a high pass filter(HPF) circuit using R and L, and here, the relationship between vi and v0 is as below.
In the formula above, if ω, that is, f decreases and gets smaller than constant value fc, v0/vi becomes smaller and smaller and becomes near to "0", as in fig.(b). Therefore, from the relationship of v0=Kvi, it can be found that as the frequency of vi becomes smaller than fc, v0 gets near to "0", and only high frequency of vi is expressed at v0. Using this characteristic, the circuit in fig.(a) functions as high pass filter(HPF).
C. Band Pass Filter

Fig.1-36(a) is a band pass filter(BPF) circuit, and here, the relationship between vi and v0 is as below.
In the formula above, if ω, that is, f increases and gets bigger than constant value f1, v0/vi becomes bigger and bigger, and if it becomes bigger than f2, v0/vi becomes smaller and smaller again and becomes near to "0", as in fig.(b). Therefore, the frequency of vi which is bigger than f1 and smaller than f2 is expressed at v0. Using this characteristic, the circuit in fig.(a) functions as band pass filter(BPF).
Experiment Process
1. In Block k of M01, compose an experiment circuit as in fig.3-36, make the size of input voltage as 2V(rms), change the frequency to find -3dB, -6dB frequency and record the result in the relevant column of table 1-20. Record each calculated frequency in the table.
Experiment 1-20.1 RC LPF Circuit (In Block k of M01, compose a circuit as in fig.1-37.)
1.Connection
1.Circuit Connection
Connect between right terminal of R16 and right terminal of C6 with yellow line.
2.Measuring Instrument Connection
Function Generator Connection
Connect between A+ terminal of Signal Input CH A on front panel and left terminal of R16 of Block k with red line, and between A- terminal and left terminal of C6 with black line.
Oscilloscope and Voltmeter Connection
Connect between A+ terminal of Signal Input CH A on front panel and left terminal of R16 of Block k with red line, and between A- terminal and left terminal of C6 with black line.
Connect between B+ terminal of Signal Input CH B on front panel and right terminal of C6 of Block k with red line, and between B- terminal and left terminal of C6 with black line.
2.Wiring Diagram
flash
3.Measurement
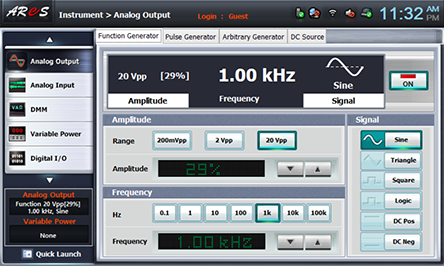
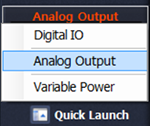
- 1Choose analog output at left menu of front panel.
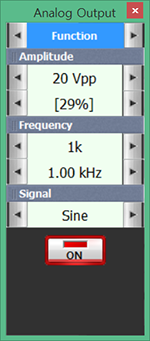
In Function Generator window, set up Amplitude as and click to set up the amplitude as amplitude 29%.
Choose Frequency as .frequency 1khz.
- Choose Signal as and click to output 1kHz 2Vrms.
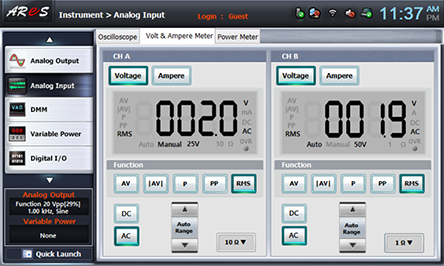
- 2Click analog input at left menu of Touch LCD panel.
Choose Volt & Ampere Meter tab and click , , for CH A, CH B.
Check out if the value of CH A is 2Vrms and record the value of CH B in table 1-20.
- 3Choose quick launch at lower part of left menu on Touch LDC panel and click Analog Output .
Click on the right of Frequency 1.00kHz and increase the frequency as much as 1kHz and record the measured value in CH B and CH B of Volt & Ampere Meter in the relevant column of table 1-20. (CH B is EC1)
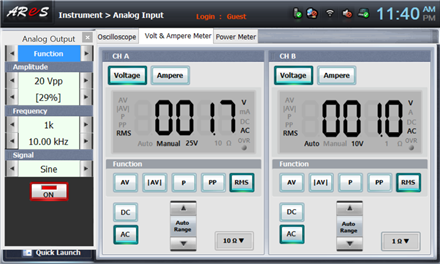
Change the frequency up to 20KHz and measure and record the result.
4.Calculation
1. Calculate the frequency that becomes 3dB, -6dB and record the result in table 1-20.
Process
1. In the circuit of fig.1-38(a), make the size of input voltage as 2V(rms), change the frequency to find -3dB, -6dB frequency and record the result in the relevant column of table 1-20. Record each calculated frequency in the table.
tab2Experiment 1-20.2 RC HPF Circuit (In Block k of M01, compose a circuit as in fig.1-38.)
1.Connection
1.Circuit Connection
Connect between right terminal of R16 and right terminal of C6 with yellow line.
2.Measuring Instrument Connection
Function Generator Connection
Connect between A+ terminal of Signal Input CH A on front panel and left terminal of C6 of Block k with red line, and between A- terminal and left terminal of R16 with black line.
Oscilloscope and Voltmeter Connection
Connect between A+ terminal of Signal Input CH A on front panel and left terminal of C6 of Block k with red line, and between A- terminal and left terminal of R16 with black line.
Connect between B+ terminal of Signal Input CH B on front panel and right terminal of R16 of Block k with red line, and between B- terminal and left terminal of R16 with black line
2.Wiring Diagram
flash
3.Measurement
- 1Execute the measurement of Experiment LPF Circuit above.
- 2(CH B is ER2)
4.Calculation
1. Calculate the frequency that becomes 3dB, -6dB and record the result in table 1-20.
Experiment Process
1. In the circuit of fig.1-39(a), make the size of input voltage as 2V(rms), change the frequency to find -3dB, -6dB frequency and record the result in the relevant column of table 1-22. Connect C6 and R17 in parallel and connect the load, and find the frequency that becomes -3dB and -6dB and record the result. Record each calculated frequency in the table 1-23.
tab3Experiment 1-20.3 LC LPF Circuit (In Block k of M01, compose a circuit as in fig.1-39.)
1.Connection
1.Circuit Connection
In Block k, connect between right terminal of L5 and right terminal of C6 with yellow line.
2.Measuring Instrument Connection
Function Generator Connection
Connect between A+ terminal of Signal Input CH A on front panel and left terminal of L5 of Block k with red line, and between A- terminal and left terminal of C6 with black line.
Oscilloscope and Voltmeter Connection
Connect between A+ terminal of Signal Input CH A on front panel and left terminal of L5 of Block k with red line, and between A- terminal and left terminal of C6 with black line.
Connect between B+ terminal of Signal Input CH B on front panel and right terminal of C6 of Block k with red line, and between B- terminal and left terminal of C6 with black line.
2.Wiring Diagram
flash
3.Measurement
- 1Choose analog output at left menu of front panel.
In Function Generator window, set up Amplitude as and click to set up the amplitude as amplitude 29%.
Choose Frequency as . frequency 1khz.
Choose Signal as and click to output 1kHz 2Vrms.
- 2Click analog input at left menu of Touch LCD panel.
Choose Volt & Ampere Meter tab and click , , for CH A, CH B.
Check out if the value of CH A is 2Vrms and record the value of CH B in table 1-22.
- 3Choose quick launch at lower part of left menu on Touch LDC panel and click Analog Output .
Click on the right of Frequency 1.00kHz and increase the frequency as much as 1kHz and record the measured value in CH B and CH B of Volt & Ampere Meter in the relevant column of table 1-22 (LPF) No Load.
- 4Connection and Measurement of Resistance Load R17
In Block k, connect between left terminal of R17 and left terminal of C6, and between right terminal of R17 and right terminal of C6 with yellow lines.
Execute XMeasurement 1)~3)Execute Measurement 1)~3) and record the measured value in CH B in the relevant column of table 1-22 (LPF) Load. and record the measured value in CH B in the relevant column of table 1-22 (LPF) Load.\
- 5Change the frequency up to 20KHz and measure and record the result.
4.Calculation
1. Calculate the frequency that becomes 3dB, -6dB and record the result in table 1-23.
Experiment Process
1. In the circuit of fig.1-40(a), make the size of input voltage as 2V(rms), change the frequency to find -3dB, -6dB frequency and record the result in the relevant column of table 1-22. Connect L5 and R17 in parallel and connect the load, and find the frequency that becomes -3dB and -6dB and record the result. Record each calculated frequency in the table 1-23.
tab4Experiment 1-20.4 LC HPF Circuit (In Block k of M01, compose a circuit as in fig.1-40.)
1.Connection
1.Circuit Connection
In Block k, connect between right terminal of L5 and right terminal of C6 with yellow line.
2.Measuring Instrument Connection
Function Generator Connection
Connect between A+ terminal of Signal Input CH A on front panel and left terminal of C6 of Block k with red line, and between A- terminal and left terminal of L5 with black line.
Oscilloscope and Voltmeter Connection
Connect between A+ terminal of Signal Input CH A on front panel and left terminal of C6 of Block k with red line, and between A- terminal and left terminal of L5 with black line.
Connect between B+ terminal of Signal Input CH B on front panel and right terminal of L5 of Block k with red line, and between B- terminal and left terminal of L5 of Circuit-5 with black line.
2.Wiring Diagram
flash
3.Measurement
- 1Execute Measurement 1)~3) of Experiment LPF Circuit and record the measured value in CH B in the relevant column of table 1-22 (HPF) No Load.
- 2Connection and Measurement of Resistance Load R17
In Block k, connect between left terminal of R17 and left terminal of L5, and between right terminal of R17 and right terminal of L5 with yellow lines.
Execute Measurement 1)~3) and record the measured value in CH B in the relevant column of table 1-22 (HPF) Load.
- 3the frequency up to 20KHz and measure and record the result.
Wiring Diagram
flash
4.Calculation
1. Calculate the frequency that becomes 3dB, -6dB and record the result in table 1-23.
Experiment Result Table
1. Experiment Result Table
1. Draw the measurement value of table 1-20 in the graph below.
 (LPF)
(LPF)
(HPF)
2. If the point of 2V is 0 dB and point of 1.5V is –3dB, record the Y axis value of the point that meets the graph in table 3-20. Also, if the point of 1.0V is -6dB, record the Y axis value of the point that meets the graph in table 1-21.
2. Review and Explanation
1) In the given circuits of fig.1-37, 1-38, calculated the cutoff frequency(fC) and the frequency at the point of –6dB, record the result in table 1-21 and compare it with the measured result.
2) Explain why measured fC and calculated fC are different..
3. Discuss the experiment result.
Experiment Result Report
1. Experiment Result Table
1) Draw the measured value of table 1-22 in the graph below. (Red - Load, Green - No Load)
(LPF)
(HPF)