PART1R, L, C Circuit
Experiment 18 :Serial Resonant Circuit
Theory
As in fig.1-30(a), when R, L, C elements are connected in series, the size and phase of their AC combined resistance, that is, the impedance Z, are as below.
Impedance : 
Size : 
Phase : 
In L-C serial circuit, at the frequency that becomes ω0 L = 1 / ( ω0 C), Z of the circuit has the pure resistance only, and the frequency here becomes the resonant frequency. The angular frequency satisfying this condition is ω0 = 1 / √ LC and this ω0 is called resonant angular frequency, and the resonant frequency f0 is as below.
The relationship between resonant frequency and current is as fig.1-30(b). Here, if the current flowing at the resonant frequency f0 is “1” and the frequencies that become ±(√ 2) are f1,f2 then Q(quality factor) which indicates sharpness of the curve can be defined as below.
The bigger Q is, the narrower the bandwidth becomes, and the smaller Q is, the wider the bandwidth becomes.
Experiment Process
1. In Block i of M01, connect Function Generator, oscilloscope or AC voltmeter as in fig.1-31(a).
2. Make the output of Function Generator as 20Vp-p, and change the frequency from1kHz to 10kHz by 200Hz interval to record the output voltage V in table 1-18. Find the frequency that becomes 0dB(resonant frequency) and record in table 1-18. And find the frequency that becomes -3dB, -6dB and record in the relevant column.
tab1Experiment 1-18.1 RLC Serial Resonant Circuit (Compose as in fig.1-31.)
1.Connection
1.Circuit Connection
Connect between right terminal of L3 of Block I and upper terminal of R13 with yellow line.
2.Function Generator Connection
Connect between A+ terminal of Signal Input CH A on front panel and left terminal of C4 of Block i with red line, and between A- terminal and lower terminal of R3 with black line.
3.Measuring Instrument(Voltmeter) Connection
Connect between A+ terminal of Signal Input CH A on front panel and left terminal of C4 of Block i with red line, and between A- terminal and right terminal of L3 with black line.
Connect between B+ terminal of Signal Input CH B on front panel and upper terminal of R13 of Block i with red line, and between B- terminal and lower terminal of R13 with black line.
2.Wiring Diagram
flash
3.Measurement
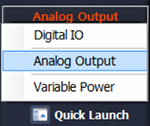
- 1Choose analog output at left menu of front panel.
In Function Generator window, set up Amplitude as , Frequency as , Signal as and click to set up as 2kHz. Click to output 2KHz 20Vp-p.
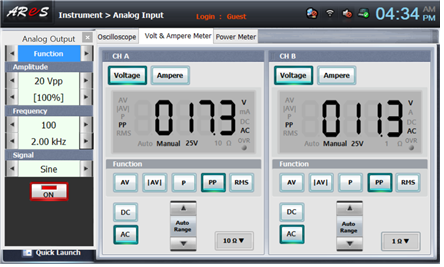
- 2Click analog input at left menu of Touch LCD panel.
Choose Volt & Ampere Meter tab and click , , for CH A, CH B and then the measured value is indicated. Record in the relevant column of table 1-18. CH A is EX(EXC + EXL), and CH B is ER value.
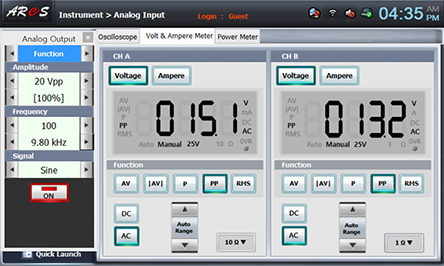
- 3Change the frequency as in table 3-18 and measure and record the result in the relevant column of table 1-18.
Choose quick launch at lower part of left menu on Touch LDC panel and click Analog Output.
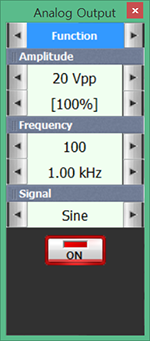
Click on the right of Frequency 100Hz and change the frequency by 200Hz and record the measured value in CH A and CH B of Volt & Ampere Meter in the relevant column of table 1-18.
- 4After the measurement, click to cut off the output of function generator.
Experiment Result Report
1. Experiment Result Table
2. Review and Explanation
1) Calculate the resonant frequency using table 1-18 above and draw the graph below and compare it with the resonant frequency.