PART1R, L, C Circuit
Experiment 10 :RC Circuit and Transient Phenomenon of DC
Theory
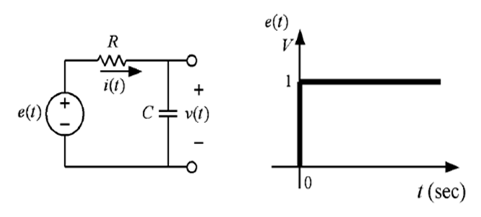
To analyze the transient phenomenon of a circuit including the resistance and the capacitor, consider a circuit as in the fig. below. The input of this circuit is the voltage signal, e(t), and when it is the unit step function as in fig.1-16, let’s find out the voltage v(t) between both ends of the capacitor. In the fig. the current i(t) flowing at the resistance is same as the current entering the capacitor, and the current of capacitor is as below.

If the formula above is arranged, the simple differential equation as below can be earned.

If the equation above is solved by supposing the initial voltage of capacitor as 0, the value of differential equation below can be earned.

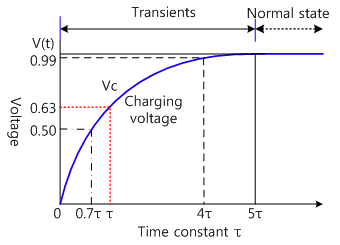
In the formula above, τ = RC is the time constant of the circuit above, and when t =τ, v(t) =1−e−1 = 0.63. Fig.1-17 is the waveform of v(t).
Experiment Process
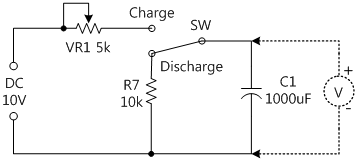
1. Connect the circuit as in fig.1-18 and adjust VR1 as 1kΩ using the resistor
2. Connect DC 10V, connect oscilloscope at both ends of capacitor, turn SW toward Charge so the capacitor can be charged. Draw the charging curve of oscilloscope in graph 1.
3. Turn SW toward Discharge so the charged voltage of capacitor can be discharged through R7 to become 0V. Likewise, draw the discharging curve of oscilloscope in graph 2.
4. Use the formula of r= R ×C, calculate the value of τ with the value of VR1, C1.
5. In the charging curve, calculate the time taken till the voltage applied to the capacitor becomes 6.32V and record the result in the relevant column of table 1-10.
6. In the discharging curve, calculate the voltage applied to the capacitor according to the discharging time and record the result in the relevant column of table 1-10.
7. Change the resistance of VR1 as 200Ω, draw charging/discharging curve through the process above, calculate the charge/discharge time to record in the relevant column of table 1-10.
8. Compare the time difference when compared to the time of 1kΩ.
tab1Experiment 1-10.1 In Block d of M01, compose a circuit as in fig.1-18.
1.Connection(M01 Module)
1.Connect the measuring module(ARES-EI-M01) to the platform.
2.Circuit Connection
Connect 1, 2 terminals of VR1 on the left of Block a with yellow lines.
Connect terminal 1 of VR1 on the left of Block a to the left terminal of VR1 of Block d with yellow line, and terminal 3 to the right terminal with yellow line.
Connect between left terminal of SW and right terminal of VR1 with yellow line. Here, the location of toggle should be at the left(OFF).
3.Power Connection
Connect between V1 terminal of Variable Power and left terminal of VR1 of Block d with red line, and between COM terminal and left terminal at the lower part of r7 with black line.
4.Measuring Instrument Connection
Connect between A+ terminal of Signal Input CH A and upper terminal of C1 with red line, and between A- terminal and lower terminal of C1 with black line.
2.Wiring Diagram
3.Measurement
- 1Choose variable power at left menu of Touch LCD panel.
- 2Choose 3 CH DC tab and click at DC Voltage V1 to set up 10V.
Double click DC Voltage V1, click 1, 0 and ok using Quick Number Keypad, and the number is set up directly.
Click , and then the output of DC 10V is inputted to the circuit.
- 3How to Set up Resistance of VR1.
To measure the resistance, the power should be cut off from the circuit.
Therefore, remove the yellow line connected between 5k VR1 terminal and left terminal of VR1 of Block d.
Connect between High terminal of multimeter and left terminal of VR1 of Block d with red line, and connect between Low terminal and right terminal of VR1.
When you choose dmm at left menu of Touch LCD panel, Digital Multimeter window appears, and if you click , the resistance value is indicated. Turn the handle to make 1kΩ.
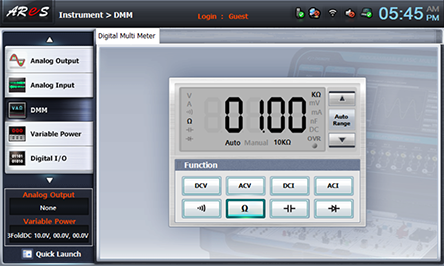
Remove the line connected to Multimeter, and connect between 5k VR1 and left terminal of VR1 of Block d with yellow line again.
- 4Choose analog input at left menu of Touch LCD panel, and click Oscilloscope tab.
Charging Curve Measurement
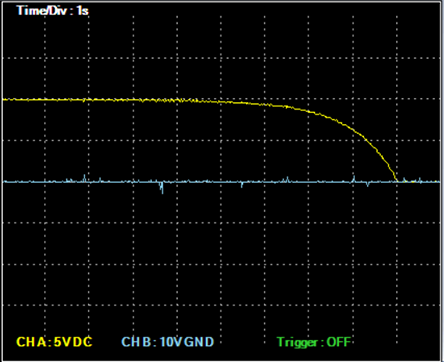
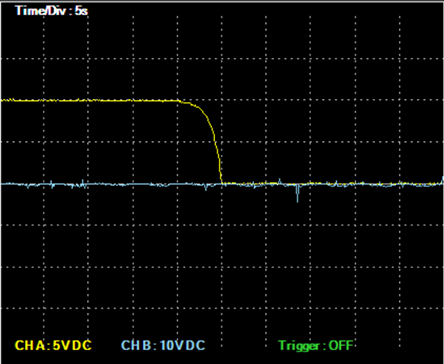
At CH A, locate Horizontal[Time/Div] at 5s, and set up Vertical[Volt/Div] as 5V.
Locate the toggle of SW at the right(ON) and charge the capacitor, then the charging curve appears at CH A, then click Stop at certain point and draw the result in the graph of table 1-10.
Discharging Curve Measuremen
At CH A, locate Horizontal[Time/Div] at 10s, and set up Vertical[Volt/Div] as 5V.
Locate the toggle of SW at the left(OFF) and stop the charging of the capacitor, connect the line connected from left terminal of SW to right terminal of VR1 to upper terminal of R7, turn the toggle of SW to the right(ON) to discharge, then the discharging curve appears at CH A. Click Stop at certain point and draw the result in the graph of table 1-10.
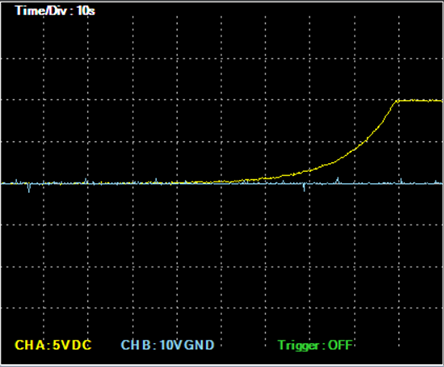
- 5Change the resistance of VR1 as 200Ω to execute the measurement process above and record the result in the graph and in the relevant column of table 3-10.
- 6After the measurement, click at Variable Power to cut off the power.


